
description Chartio Overview
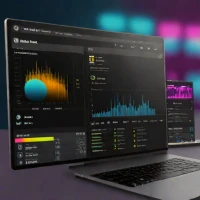
Chartio is a cloud-based data visualization and business intelligence platform focused on ease of use and rapid dashboard creation. It connects to various data sources and allows users to build interactive dashboards with drag-and-drop functionality. Chartio's strength lies in its simplicity and quick deployment. Its a good choice for small to medium-sized businesses seeking a straightforward BI solution.
help Chartio FAQ
What was Chartio used for?
Chartio was a cloud-based data visualization and business intelligence platform for building interactive dashboards. It connected to data sources and emphasized rapid dashboard creation.
Did Chartio require SQL to build dashboards?
Chartio combined drag-and-drop dashboard building with data-source connections, making it approachable for users who did not want to write every query by hand. More advanced analysis could still involve database and SQL knowledge.
What made Chartio different from a basic spreadsheet chart?
Chartio was designed for interactive dashboards connected to live business data rather than one-off charts in a spreadsheet. Its visual workflow let teams explore and present multiple metrics in one shared view.
Is Chartio still an active analytics platform?
Chartio is best treated as a legacy product rather than a current standalone analytics service. Anyone looking for a live replacement should verify the present status of the platform and its successor options before planning a migration.
explore Explore More



Reviews & Comments
Write a Review
Be the first to review
Share your thoughts with the community and help others make better decisions.


